Data Normalization in the Data Warehouse: A Playbook for First-Party Marketing Data
A marketer’s ability to drive performance relies heavily on quality data. In today’s privacy-first digital landscape, data is more abundant, more fragmented and more fraught with risk than ever before. In addition to the MarTech systems needed to safely collect and manage data, marketers and business leaders must understand how to integrate data from disparate sources in a secure, privacy compliant manner that unlocks essential insights.
This requires data normalization.
What is Data Normalization?
At its core, it’s the process of transforming messy, inconsistent, and siloed data into a harmonized format so that it can be combined in a way that insights can be drawn accurately and consistently. When applied to marketing and customer data, normalization becomes the foundation for unified reporting, trustworthy analytics, and scalable growth.
Why does it matter now? The shift to first-party data strategies, fueled by tighter privacy regulations (like GDPR, CCPA, and HIPAA) and the deprecation of third-party cookies, has forced organizations to rethink how they collect, organize, and use data. This is especially critical in MedTech, healthcare, and other highly regulated industries where compliance and precision are paramount.
Who is this guide for?
- Executives and CMOs who need a high-level understanding of how data normalization affects strategy, compliance, and business performance.
- Marketing and analytics leaders tasked with implementing scalable data solutions and aligning teams on a single source of truth.
- BI, data engineering, and platform teams who do the hands-on work of building, maintaining, and evolving the data pipeline.
How to use this guide: This guide is structured to meet your needs:
- Part 1 is a strategic overview for executives and marketers.
- Part 2 provides tactical detail for managers and directors.
- Part 3 offers technical guidance and playbooks for data teams.
- Part 4 explores the future of normalization and key trends to watch.
Whether you read end-to-end or jump to your role, the objective is the same: help you understand, implement, and benefit from well-normalized first-party data.
Executive Summary
This guide explains how to normalize marketing and analytics data to create a single source of truth for first-party data. Readers will learn:
- What data normalization is and why it matters for compliance and decision-making
- How normalization fits into a privacy-first MarTech stack
- How Wheelhouse structures data pipelines using ELT
- Key governance and security standards for HIPAA, CCPA, and GDPR compliance
- Practical steps for BI teams to build and maintain normalized datasets
- What’s next: the future of real-time and AI-assisted normalization
Framing This Guide Within a Broader MarTech Strategy
This guide is part of our Ultimate Guide series focused on building a privacy-first marketing stack. In our foundational piece, “The Ultimate Guide to Privacy-Compliant MarTech“, we introduced a comprehensive model that outlines the 12 essential categories of a privacy-first marketing stack.
In that framework, ETL/ELT and data normalization play a critical connecting role across categories. Whether you’re unifying campaign performance across ad platforms or tying marketing data to CRM and analytics systems, clean and consistent data is the foundation of both compliance and performance.
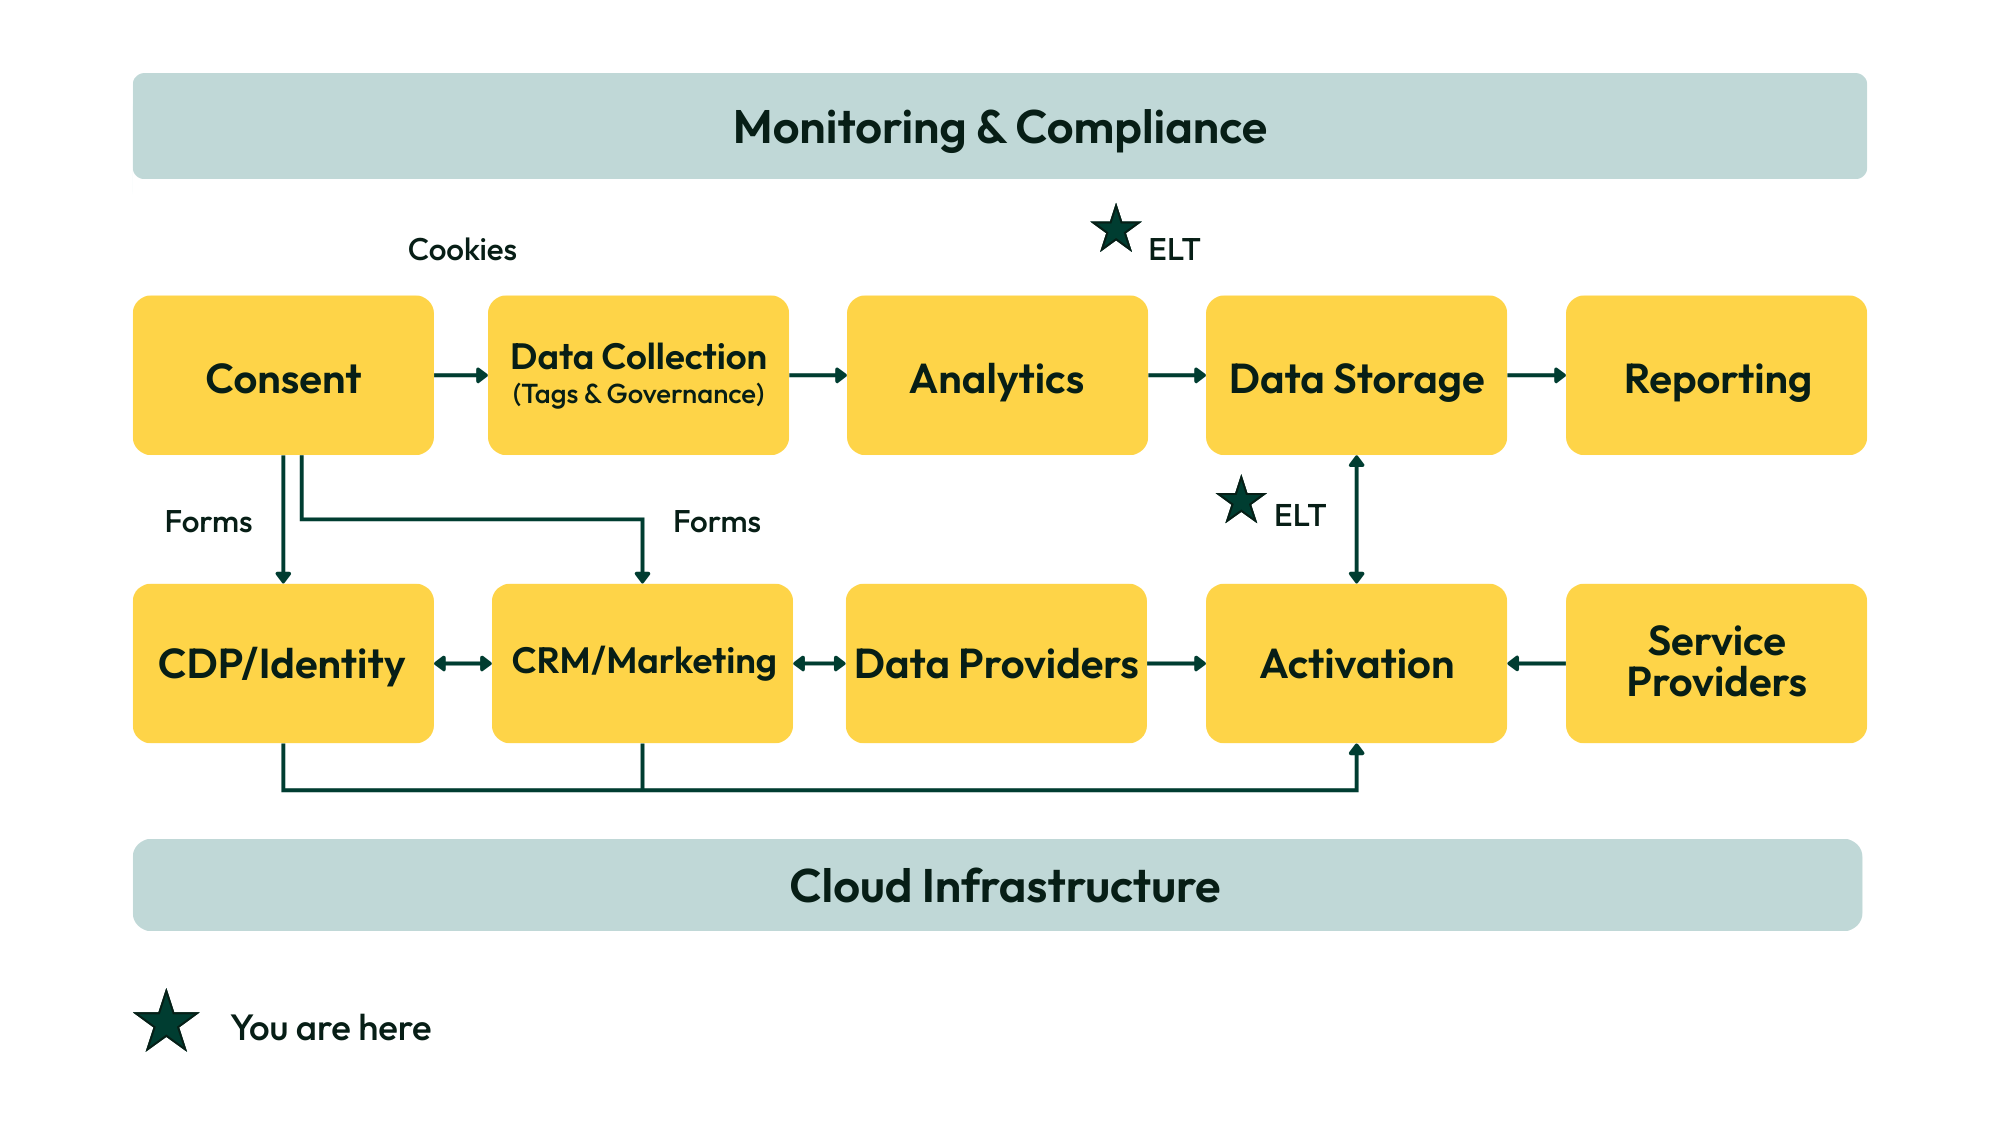
This guide zooms in on one of the most critical, and often overlooked, components of a privacy-first MarTech stack: data normalization. With this foundation in place, let’s look at why normalization matters, how it works, and what teams across your organization can do to ensure data readiness in a privacy-first world.
Part 1: The Executive & Marketer’s View
Why Normalization Matters
Data normalization is one of the most critical pillars of modern marketing operations. As organizations collect customer data from a growing number of sources (Meta, Google, Salesforce, TikTok, Adobe, CRMs and more), the differences in how each platform structures, measures, and defines its data create a fragmented picture.
This fragmentation leads to:
- Conflicting metrics and misaligned KPIs
- Inability to accurately attribute marketing performance
- Confusion and mistrust among stakeholders
- Costly inefficiencies in decision-making and budgeting
Without normalization, your team may be effectively comparing apples to oranges, especially when platforms use different time zones, attribution windows, granularity (e.g., ad vs. campaign level), or define conversions differently. The result is unclear performance, wasted budget, and missed opportunities.
The Business Benefits of Normalization
When done well, normalization enables a consistent, trustworthy view of your marketing and business data. For executives and marketing leaders, this translates into:
- Unified reporting across channels: View performance from Meta, Google, TikTok, and others in a single, normalized model. Enables easy segmentation by shared campaign attributes or audiences and supports smarter budget reallocation both across and within channels. Apples-to-apples comparisons are enforced through standardized metrics and dimensions.
- Confident decision-making: Make strategic choices backed by data that reflect reality, not conflicting (or worse, self-serving) platform narratives —validated via routine UI ↔ warehouse data parity checks.
- Alignment of marketing and business KPIs: Bridge the gap between what marketing tracks and what the business values, from spend to revenue to ROI.
- A stronger compliance posture: Normalized data in a secure environment can enable better governance and control, which supports HIPAA, CCPA, and GDPR compliance efforts through role-based access control, client-level isolation, and clear data lineage.
Privacy & Compliance at the Leadership Level
As privacy regulations become stricter and enforcement increases, normalization plays a key role in reducing compliance risks. Proper normalization ensures that:
- Personally Identifiable Information (PII) and Protected Health Information (PHI) are never exposed in analytics layers.
- Data access is governed through role-based permissions
- Data pipelines are built with security and auditability in mind
A centralized, normalized first-party warehouse enables clear separation of client data, anonymized identifiers, and complete control over data retention, all critical features for HIPAA and GDPR readiness.

Wheelhouse Insight
Quick Wins for Leaders
Even without getting into the technical weeds, executives can support better normalization and data governance through a few high-impact actions:
- Support a culture of governance: Back efforts to implement and enforce data standards, schemas, and ownership models.
- Push for standard naming conventions: Encourage teams to align on clear, consistent naming practices for campaigns and metrics at the source.
- Fund the “single source of truth”: Resource the BI/data team appropriately so they can build and maintain a reliable reporting foundation.
- Ask better questions: Insist on clarity in reporting and alignment between data and business objectives.
Now that we’ve explored why normalization is critical from a business perspective, let’s look at how it fits within a modern data pipeline.
Part 2: The Practitioner’s View
How Normalization Fits into the Data Pipeline
Normalization isn’t a one-off task, it’s an integrated part of a multi-layered data infrastructure. At Wheelhouse, this process is built around an ELT (Extract, Load, Transform) architecture that emphasizes data integrity, scalability, and accountability across every step of the pipeline. Normalization is enforced through model contracts, tests, access controls, and documented lineage so results are repeatable and audit-ready.
Explaining the ELT Process Diagram
How data moves from raw sources to normalized insights:
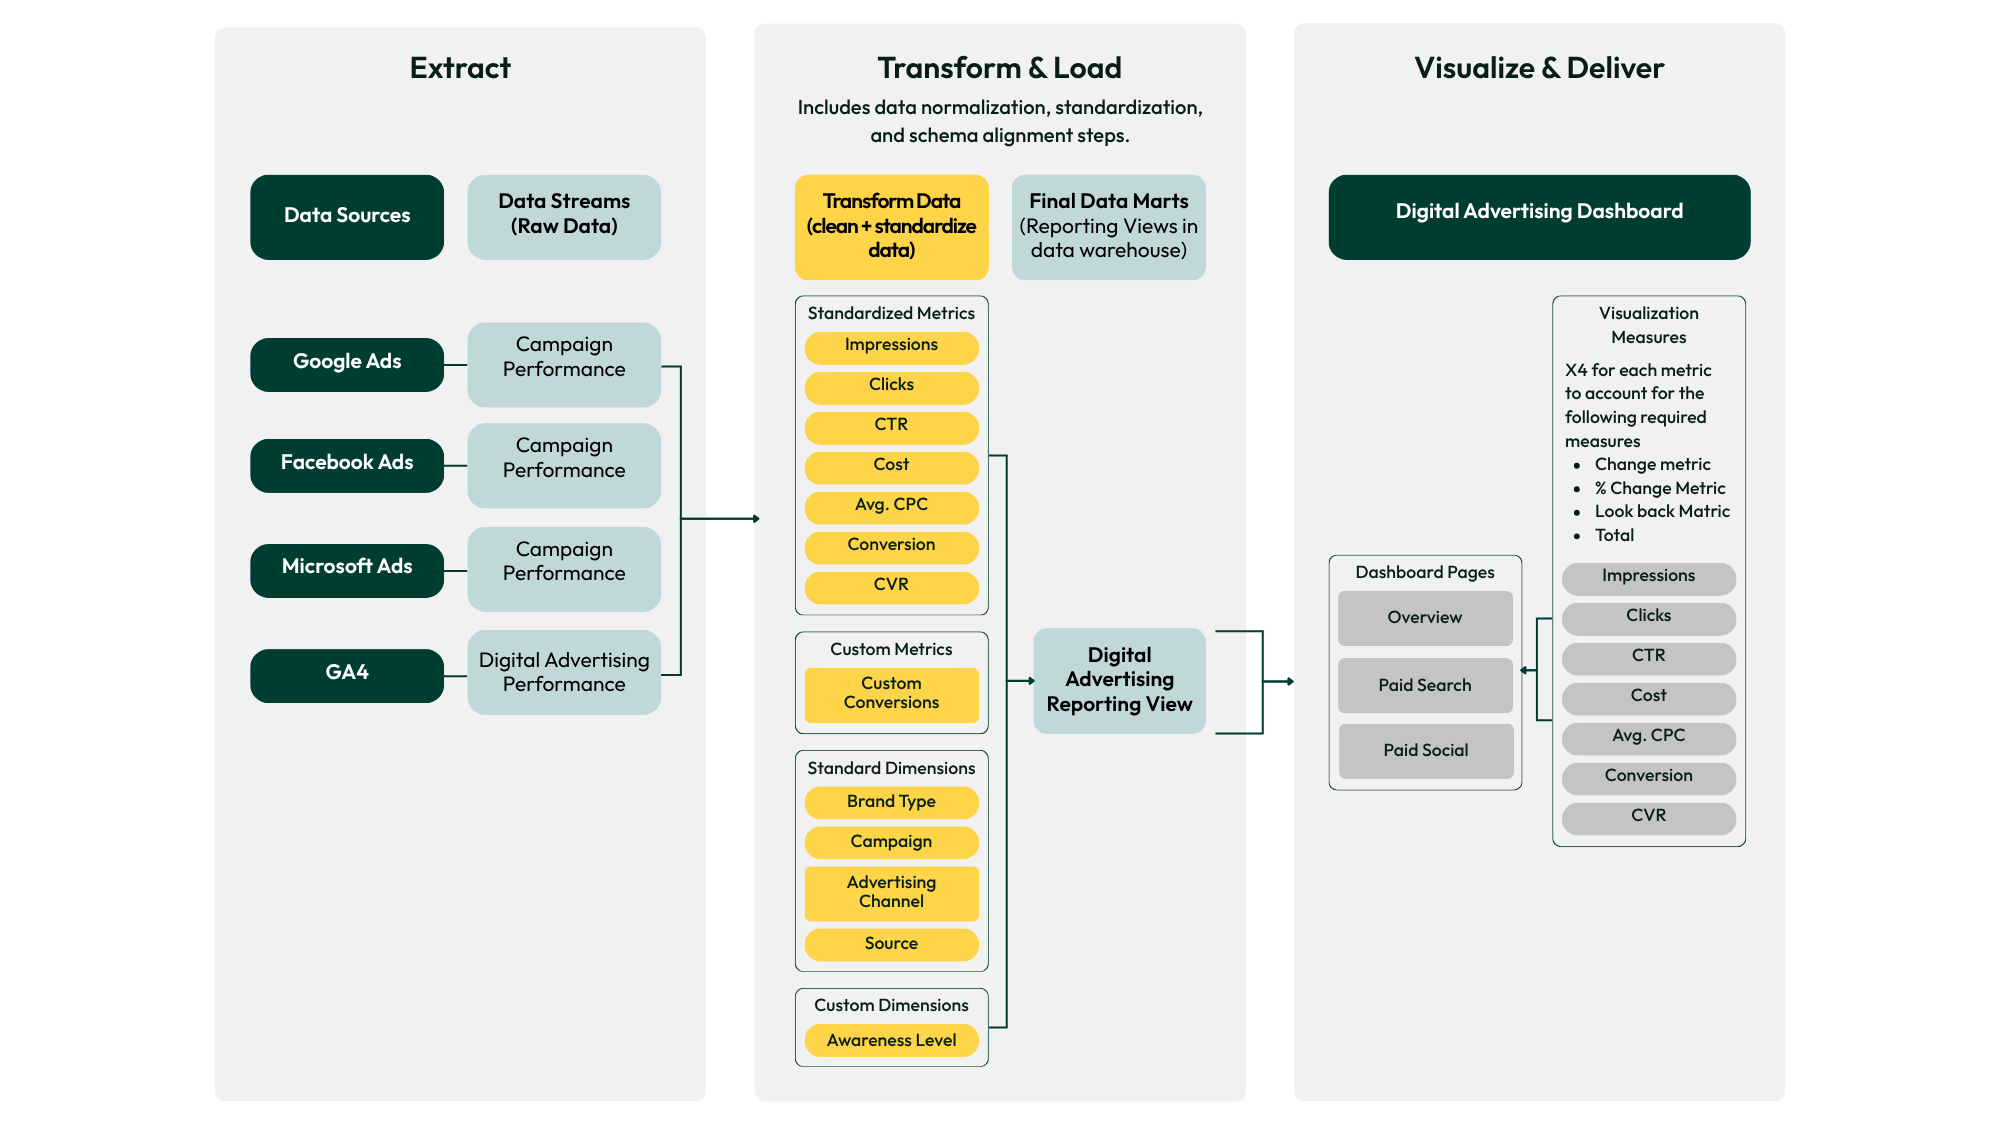
The visual framework illustrates the full end-to-end flow from raw data ingestion to final dashboard output. Here’s a detailed breakdown of the three main sections and the role each one plays:
Wheelhouse Insight
Section 1: Extract & Stream
Purpose: Provide a reliable interface between external data sources and the warehouse. Extract raw data and route it through structured streams to ensure clean, traceable ingestion into Redshift.
Key Components:
- Data Sources: Google Ads, Meta (Facebook) Ads, Microsoft Ads, GA4, CRM & first-party data (and others as needed).
- Data Streams: Structured extractions (e.g., Campaign, Ad Set, Ad Performance), with explicitly defined grain (e.g., ad/day) and attribution windows.
Framework: Stream Strategy Model
- Each source emits multiple streams by required granularity (e.g., campaign-level for PMax, ad-level elsewhere).
- Naming conventions adhere to a documented internal standard (campaign/ad taxonomy and KPI mappings), reducing downstream rework.
- Before any data enters the warehouse, a test fetch is performed and validated.
Tools:
- Adverity (used at Wheelhouse): Chosen for its flexibility, scalability, and fine-grained control over data ingestion. Unlike previous tools, Adverity imposes no limit on the number of data sources and delivers significantly faster extraction speeds—leading to quicker ingestion and time savings across pipelines. It also supports in-app data transformations, enabling earlier-stage normalization and improved flexibility before data even reaches the warehouse. These capabilities make it ideal for managing complex, multi-client data environments and ensuring high-quality, QA-ready data before ingestion.
- Supermetrics (previously used): Lightweight and easy to deploy, but lacks the structural rigor, transformation flexibility, and granularity controls needed for large-scale client pipelines. Ultimately replaced by Adverity due to performance, reliability, and scalability limitations.
- Direct connection to platforms via their native API’s: This is how we started – and we don’t recommend this approach. Our experience has been that many of these APIs change frequently, often without notice and sometimes without update to API documentation. As a result, our data pipeline was too often interrupted by API issues that required hours or days from our engineering team to correct. There is a reason data extraction platforms like Adverity have teams of engineers dedicated to maintaining connection to each platform API.
- Alternatives: Fivetran, Airbyte, Funnel.io
Section 2: Transform & Normalize
Purpose: Amazon Redshift (our cloud data warehouse) and dbt (our in-warehouse transformation framework) perform all normalization processes through a 4-layer model. This is where raw data is standardized, structured, and made analysis-ready—with tests and lineage to verify trustworthiness.
Key Components (dbt):
- Source > Staging > Intermediate > Mart model in dbt
- Source: These models pull raw tables directly from Redshift. They include no logic or transformation and serve as the foundation of the dbt project – just exact mirrors of the source for lineage and troubleshooting.
- Staging: Initial normalization happens here. We align field names, standardize data types, and apply business logic using naming conventions as the mapping source for downstream taxonomy. We also create additional derived dimensions as needed, declare the table grain (e.g., ad × day), and ensure deduplication before anything moves downstream.
- Intermediate: These models consolidate and unify multiple staging models into a single, consistent structure. For example, we join data from Google, Meta, and TikTok and handle grain differences—e.g., PMax is campaign-level while most other sources are ad-level. This is also where attribution windows are harmonized across platforms, shared dimensions are conformed (product, awareness level, objective), and deduplication and stable join keys are finalized.
- Mart: Final presentation-ready models designed for direct use by the BI team. These models reflect business concepts and KPIs and are optimized for reporting. They include standardized metrics and dimensions, as well as any client-specific logic. Marts are read-only, versioned, and optimized for reporting; any row-level filtering/permissions live here—not upstream.
- Digital Advertising Reporting View that unifies cross-platform data
- Standard Metrics: Impressions, Clicks, CTR, Cost, Avg. CPC, Conversions, CVR, CPL, Revenue
- Standard Dimensions: Brand Type, Campaign, Channel, Source
- Custom Dimensions: Client-specific categorizations extracted from campaign naming conventions, such as Product Line, Funnel Stage, User Intent & Awareness Level, Region, Language, etc.
- Custom Metrics: Non-standard KPIs tailored to business goals, such as demo requests, CRM conversion types, Zoom signups, or composite metrics like weighted lead scores
Normalization Logic Includes:
- Currency and time-zone standardization
- Attribution window reconciliation (e.g., Meta view-through vs. Google click-through; documented lookbacks)
- Parsing campaign naming conventions into taxonomy-based dimensions (Product Line, Funnel Stage, Region, Language, Channel)
- CRM joins via UUIDs
- Grain declaration and enforcement (e.g., ad × day), with deduplication for overlapping windows/late restatements
- Type and unit alignment: store numbers as numbers (not text), and keep units/date types consistent
- Null and edge-case handling: prevent divide-by-zero, guard against negatives, and flag zero-spend rows
- Cross-platform metric alignment (link clicks, conversions, viewable impressions)
- UTM/source normalization (source / medium / campaign fields)
- Ingesting platform Click IDs for tying offline behaviors back to the campaigns that drove them
Section 3: Data Visualization Layer
Purpose: This is the final step, where normalized data is turned into actionable insight via dashboards built in Power BI, Tableau, Looker Studio, or Amazon QuickSight.
Key Components:
- Dashboard Pages: Typically include Overview, Paid Search, Paid Social
- Visualization Metrics: Each core metric is represented in multiple ways:
- Raw value
- Change over time
- Percent change
- Lookback period comparisons
Framework: Dashboard Optimization Model
- Centralize Logic Upstream: Metrics are calculated in dbt, not in the visualization tool
- Visualization-Specific Measures: Built for interactivity and analysis but not raw computation
- QA & Monitoring: Dashboards include spend checks or anomaly alerts to flag missing or broken data feeds
- Security & Governance: Role-based permissions control access to client-specific dashboards
Common Data Sources & Challenges
Paid Media:
- Google Ads – Performance Max is campaign-level only (no ad/ad-group grain). Requires separate handling for attribution and taxonomy compared to standard Search/Display.
- Meta (click-through vs. view-through attribution)
- TikTok, LinkedIn, Microsoft Ads
- DSPs — Some DSPs to not support direct reporting API. In these instances, we ingest scheduled email reports via the Mailgun API as a workaround.
CRM Systems:
- Salesforce (preferred via direct integration): Enables reliable normalization and linkage via UUIDs.
- HubSpot, EMRs, call centers

Wheelhouse Advice
Analytics Platforms:
- GA4 (client-side and server-side)
- Adobe Analytics – The API is slow and can backlog Adverity jobs.
Note, GA4 services for healthcare require additional configuration to ensure server-side event collection and HIPAA-compliant data handling before data enters the normalization pipeline.
Offline & SEO Tools:
- Google Search Console, Traject (via Lighthouse)
- Weather data, referral and appointment systems for media mix modeling
Each source requires custom handling, but Wheelhouse begins every integration with a standardized base approach.
Normalization Challenges & Solutions
Inconsistent Naming Conventions
- Challenge: Human error + platform/team drift = messy labels and bad rollups.
- Solution: Enforce a documented naming standard at the source, add pre-ingestion checks, and route exceptions through a QA feedback loop. Parse naming into taxonomy fields in dbt.
Attribution Discrepancies
- Challenge: Google vs. Meta attribution windows (e.g., click vs. view) don’t line up.
- Solution: Use a daily 7-day rolling pull in Adverity to capture window effects and restatements
Wheelhouse Caution
Granularity Mismatches
- Challenge: Mixed grains across sources (e.g., PMax is campaign-level, others are ad/ad-set).
- Solution: Create separate streams by grain, declare grain in staging (e.g., ad × day), and standardize rollups in intermediate.
Time Zones & Currencies
- Challenge: Apples-to-oranges when accounts run in different locales and currencies.
- Solution: Normalize timestamps to a single reporting time zone (agreed with the client) and convert costs to a single reporting currency using documented FX rates.
Custom Metrics & Dimensions
- Challenge: Client-specific conversions and taxonomies add complexity.
- Solution: Modularize in dbt, keep core metrics/dimensions stable, and isolate client-specific logic in clearly documented models.
Late or Restated Data
- Challenge: Platforms re-state conversions; numbers “creep.”
- Solution: Standardize a 7-day lookback for scheduled reprocessing, and re-aggregate during normalization.
Duplicates & Keys
- Challenge: Overlapping windows/retries create duplicate rows.
- Solution: Define stable keys (e.g., id + date), enforce uniqueness in staging, and finalize deduplication in intermediate before marts.
Data Parity
- Challenge: Warehouse totals don’t match the platform UI.
- Solution: Run routine parity checks on spend/clicks/conversions and hold pushing to production until reconciled.
Governance, Privacy, & Compliance
Wheelhouse enforces strict governance through architectural decisions:
- Separation by Client: Unique schemas, jobs, folders in Adverity, Redshift, dbt, and visualization platforms
- Role-Based Access Control: Only authorized users access sensitive data at each level
- UUIDs Instead of PII: Used to match leads to campaigns safely
- Audit Trails: Git versioning for dbt, metadata tracking in Redshift
These measures allow teams to remain HIPAA, CCPA, and GDPR-compliant while still delivering detailed marketing performance insights.
Best Practices & Standards
Pipeline Structure
- Four-level dbt model: Source > Staging > Intermediate > Mart
- Prefix final tables with
production_reporting_
Reusability
- Macros for parsing naming conventions
- Standardized attribution schemas
- Templates for each common platform (Google, Meta, TikTok)
QA & Monitoring
- Alerts in Adverity and dbt for failed fetches or jobs
- Slack alerts for zero-spend flags
- Row count comparisons, field-level checks, UI-to-database validation
Documentation
- Naming rules documented in the “Adverity Bible”
- Logic and models tracked via Git
- Internal knowledge sharing supports new team member onboarding
For technical teams, normalization moves from concept to code. The next section breaks down how to build and govern the process.
Part 3: The Technical “How-To” View
This section is designed for BI developers, data engineers, and technical analysts who are responsible for building and maintaining the data infrastructure. It provides detailed, actionable guidance to implement consistent, scalable, and secure data normalization processes across a wide variety of platforms and client configurations.
Normalization Step-by-Step
In a modern ETL/ELT architecture, normalization follows a standardized, repeatable framework to ensure data integrity and cross-platform consistency. A typical seven-step process is used when onboarding a new data source:
- Extract via Adverity: Configure a new datastream from the relevant advertising or analytics platform. Define the appropriate reporting granularity (e.g., campaign, ad group, or ad level) and ensure that all required metrics and dimensions are included for downstream modeling. Run and validate a test fetch before production. Document the backfill plan and Service Level Objectives (e.g., daily load complete by 8:00 AM ET). Use a standard 7-day rolling pull to capture restatements
- Stage Raw Data in Redshift: Ingested data is stored in raw tables within client-specific schemas. This structure preserves the source data’s fidelity while maintaining strict isolation between clients, ensuring that no data is ever shared or co-mingled across environments.
- Transform (Normalize) Data Using dbt: Within dbt, the raw source data is transformed into a standardized, analysis-ready structure that aligns across all platforms.
- Key normalization tasks include:
- Standardize field types and units (e.g., currency, conversion metrics, timestamps) to ensure data comparability.
- Align attribution windows across sources
- Validate and map naming conventions and business logic to the organization’s standardized schema. Adjust mappings where necessary to correct inconsistencies originating from the ad platform.
- Enforce deduplication and stable keys (e.g., id + date) prior to downstream joins
- These transformations establish a consistent, governed layer that supports downstream joins, taxonomy parsing, and metric harmonization. All models include documented lineage.
- Apply Campaign Taxonomy: Parse campaign names using structured logic to populate standardized dimensions such as Product Group, Funnel Stage, Geography, and Channel. This taxonomy creates a unified framework for cross-channel analysis and reduces downstream rework.
- Join with CRM or Offline Data: Use unique identifiers (UUIDs) to securely associate digital interactions with downstream CRM events, leads, or opportunities—enabling full-funnel performance visibility while preserving user privacy.
- QA and Validation:
- Perform row-count validation between source and warehouse.
- Conduct UI-to-database reconciliations to ensure data parity.
- Run anomaly detection checks for gaps in spend, impressions, or date coverage.
- Publish to Unified Reporting Tables: Finalized datasets are materialized as production-ready tables (typically using a
production_reporting_prefix) for use in analytics environments and reporting. These tables serve as the single source of truth for downstream analysis and reporting. Marts are read-only with stable, versioned schemas.
Wheelhouse Advice
Playbooks by Data Source
Meta Ads
- Handle click-through vs. view-through attribution
- Map campaign naming to strategic dimensions
- Manage frequent schema updates in API
Google Ads
- Handle Performance Max separately (campaign-level only)
- Reconcile multiple conversion types
- Normalize naming conventions across ad groups and campaigns
TikTok & Snapchat
- APIs are prone to version changes and latency
- Normalize creative fields and content types
- Validate spend and conversions daily
DSPs
- Some DSPs lack native API integration; You can use Mailgun for ingesting emailed reports
- Manual QA needed for report delays or schema shifts
- Join with campaign naming schema for clarity
CRM Platforms (Salesforce, HubSpot)
- Join with ad data using UUIDs
- Normalize lifecycle stages and opportunity data
- Avoid pulling PII directly; use pseudonymized keys
GA4 / Adobe Analytics
- Reconcile event-based analytics with ad platform data
- Normalize session sources and UTMs
- Handle discrepancies in conversion logic and event firing
Technical Privacy & Compliance Controls
Our data normalization workflows are designed to meet the highest standards of data security, privacy, and regulatory compliance, particularly when handling sensitive or regulated datasets (e.g., healthcare, MedTech, or financial verticals). All processes are architected to ensure data isolation, least-privilege access, and full auditability from ingestion through reporting.
Core Security Principles
- Role-Based Access Control: Access to schemas, dbt models, and reporting environments is governed by role-based access permissions. Roles are enforced across Redshift, dbt Cloud, and analytics layers, restricting visibility based on user function and client association.
- Client Data Isolation: Each client operates within a discrete environment—unique Redshift schemas, dbt project folders, and cloud workspaces—to eliminate cross-tenant visibility. Data pipelines, storage, and transformations are logically and physically separated to prevent data leakage or co-mingling.
- Anonymized Identifiers: Personally identifiable information (PII) is never transmitted or stored in raw form. Identifiers are replaced with UUIDs prior to ingestion. Downstream joins and CRM integrations use these pseudonymized values to maintain data linkage without compromising privacy.
- Field-Level Security: Sensitive attributes such as emails, or phone numbers are masked or excluded at the transformation layer.
Monitoring and Auditability
- Audit Logging: All dbt model changes are version-controlled through Git, providing full lineage and change history. Redshift logs query execution, object access, and schema modifications, supporting audit trails for internal governance and external compliance reviews.
- Data Quality and Integrity Checks: Automated QA processes validate record counts, field completeness, and data parity with source platforms. Anomalies trigger alerts via Slack or email for review before data is promoted to production.
- Data Retention and Deletion:
- Define how long raw, transformed, and derived data is stored
- Automate cleanup routines where necessary
Framework Alignment:
- HIPAA: Safeguard PHI through anonymization and secure storage
- GDPR/CCPA: Respect data subject rights and ensure auditability of consented use
Tools & Technology Options
ETL/ELT Platforms:
- Adverity (used for marketing data extraction)
- Alternatives: Fivetran, Airbyte, Stitch, Supermetrics
Transformation & Modeling:
- dbt (core transformation logic)
- SQL-based with modular structure
Warehousing:
- Amazon Redshift (in production)
- Alternatives: Snowflake, BigQuery
Visualization:
- Power BI, Tableau, Looker Studio, QuickSight
Orchestration & Monitoring:
- Dbt Cloud job scheduler
- Slack and email alerts for failed fetches and pipeline issues
Data Quality Tools:
- In-platform alerting (e.g., zero spend)
- Manual row counts and source-to-target validation
Part 4: The Future of Data Normalization
As the modern data stack continues to evolve, normalization is entering a new era, one defined by consolidation, automation, and real-time orchestration. What once required separate tools and manual coordination is increasingly handled through integrated, intelligent systems.
1. Consolidation of the Modern Data Stack
Recent developments, such as the merger between dbt Labs and Fivetran, mark a pivotal shift toward unified data infrastructure. The traditional boundaries between ingestion and transformation are blurring, allowing teams to design pipelines that are simpler, faster, and more reliable.

Wheelhouse POV
2. AI-Assisted Normalization
Machine learning is beginning to support schema mapping, anomaly detection, and even predictive QA. Future systems will auto-suggest normalization rules, identify mismatched grains, and reconcile attribution windows automatically, dramatically reducing manual oversight while improving consistency.
3. Real-Time and Streaming Architectures
As server-side and event-based tracking gain adoption, normalization will shift from batch to stream. Tools like Kafka and Snowpipe already enable near-real-time ingestion; the next step is real-time normalization, transformations applied on the fly as data enters the warehouse. This will unlock more responsive dashboards, real-time anomaly alerts, and faster decision cycles.
4. Privacy-Preserving Data Modeling
With privacy regulations expanding globally, future normalization frameworks will embed compliance rules directly in transformation logic. Expect to see dynamic masking, differential privacy, and automated consent tagging as first-class features in data models.
5. The Rise of Data Contracts and Governance Automation
Teams are increasingly formalizing how upstream and downstream systems interact through data contracts, structured agreements defining schemas, expectations, and tests. These contracts will automate governance, ensuring every model adheres to a shared standard before deployment. Combined with Git-based lineage and continuous validation, this will make normalization more predictable, testable, and auditable.
6. The Road Ahead
Normalization will remain the connective tissue of the analytics ecosystem. Whether through tool consolidation, AI-driven transformations, or real-time pipelines, the goal remains the same: trustworthy, privacy-safe, first-party data that fuels confident decision-making. For agencies like Wheelhouse DMG, these shifts present an opportunity to stay at the frontier, adopting innovation without compromising governance or compliance.
Legal Disclaimer: The information contained in this communication should not be construed as legal advice on any matter. Wheelhouse DMG is not providing any legal opinions regarding the compliance of any solution with HIPAA or other laws and regulations. Any determination as to whether a particular solution meets applicable compliance requirements is the sole responsibility of the client and should be made after consulting with their own legal counsel.